This course introduces first-year mathematics students to Python for scientific computing.
Objectives:
- Master Python syntax.
- Discover scientific libraries (NumPy, Matplotlib).
- Apply programming to linear algebra, differential calculus, and basic probability/statistics.
Benefits:
- Bridge theory-practice: Transform mathematical formulas into executable code.
- Visualize concepts: Plot functions, vector fields, statistical distributions.
- Algorithm implementation: Numerical methods, matrix operations, simulations.
- Future-proof skills: Essential for Master's/PhD research, data analysis careers.
- Immediate applications: Solve real math problems (systems of equations, derivatives.
Chapters:
- Python Introduction (Installation, Jupyter).
- Basic Syntax (Variables, Operations, Control Structures).
- Functions & Modules.
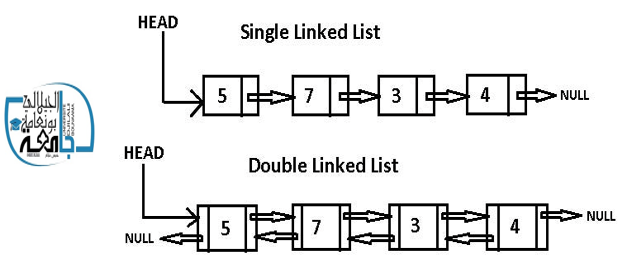
- Data Structures (Lists, Tuples, Dictionaries, Sets).
- NumPy & Matplotlib Introduction.
- Applications: Linear Algebra, Calculus, Probability.
A Brief Description
This introductory course in statistics covering fundamental concepts of descriptive statistics, numerical data representation, and combinatorial analysis. It explains how to collect, organize, summarize, analyze, and interpret data. The course includes statistical variables (qualitative and quantitative), frequency tables, graphical representations (bar charts, histograms, distribution functions), measures of central tendency (mean, median, mode), dispersion measures (variance, standard deviation), and basic combinatorics and probability concepts. Practical exercises with solutions are provided to reinforce understanding.
The Target Audience
This course is intended for university students, particularly those studying science, engineering, economics, or related technical fields. It is suitable for beginners who need a solid foundation in statistics and probability for academic or applied purposes.
The General Objectives
-
To understand the fundamental concepts of descriptive statistics.
-
To learn how to organize and represent data using tables and graphs.
-
To compute and interpret statistical measures such as mean, median, variance, and standard deviation.
-
To distinguish between qualitative and quantitative variables (discrete and continuous).
-
To apply combinatorial methods in counting and probability problems.
-
To develop analytical skills for interpreting statistical results and supporting decision-making.
- Teacher: abdelkarim kelleche
- Teacher: Mohamed HOUASNI
- Teacher: Omar BENNICHE