
This assessment is diagnostic only and will not count toward the final grade for the course.
Statistics 1
Section outline
-
This space is for communication between the professors and the students

-
The descriptive statistics course seeks to achieve educational goals through content that we will review later. It is a set of lessons and exercises in statistics 1 directed to first-year common core, prepared in accordance with the ministerial program.
This cours is divided into seven axis, where each axis contains simplified lessons so that the student can understand them with ease. It also contains a group of solved exercises and others that are unsolved so that the student can make efforts to process them.
This course aims to describe, organize, classify, summarize and display a set of data in a clear manner in the form of tables or graphic figures and calculate various statistical measures to describe a variable (or more) in a given population.
-
Syllabus Teaching Material Handbook
Course name : Statistics1
All Branches / Departements
Branch/ Departement
Economic sciences, commercial and Management sciences
Domain :
First Year Bachelor’s Degree
Level :
Common core
Speciality
2024 -2025
Academic year :
First
Semester
Familiarity with the educational material
Statistics 1
Subject Name
Methodology
Education unit
5
The number of balances
3
Coefficient
hours4.5
Weekly volume
hours3
Lecture (hours per week)
/
T work (number of hours per week)
hours1.5
M/T work (number of hours per week)
Course Supervisor
Professor
Rank
KADI NADJAT
Name & Surname
n.kadi@univ-dbkm.dz
Email
……………………..
Office location
Wednesday
8:30-10:00
Amphi2
Course Time and place
............................
Phone Number
Directed Works Supervisor
MCA
Rank
GHIDA FOUZIA
Name & Surname
Fouzia.ghida@univ-dbkm.dz
Email
Time
Room
Group
Professor
Rank
GHIDA FELLA
Name & Surname
f.ghida@univ-dbkm.dz
Email
Time
Room
Group
-
The chapters of this course have been distributed according to the official decision of the Ministry of Higher Education and Scientific Research into the following seven axes:
The first axis: Statistics overview
The second axis:Tabular display of data
The third axis:Graphical presentation of data
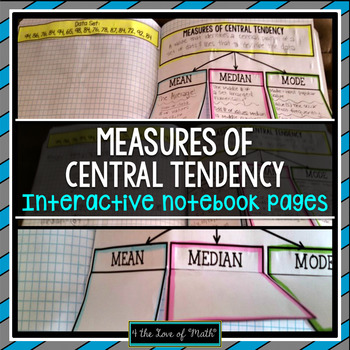
The fourth axis: Measures of center (measures of central tendency)
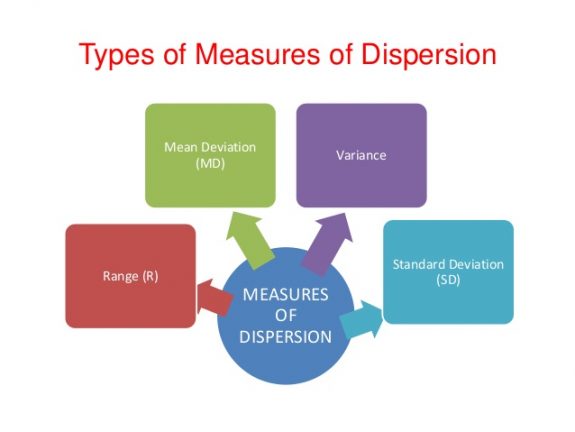
The fifth axis: Measures of dispersion (of viability)
: The sixth axisForm measurements
The seventh axis: Concentration measurements
Each axis contains a series of simple and brief lessons supported by many examples and exercises presented with typical solutions, in order to alleviate the difficulties facing students in achieving a better understanding of this course, which is summarized in the following map:
-

After studying this course, the student will be able to :
- Mastering the basic concepts of decriptive statistics ;
- Summarize and tabulate data in tabular form and represent it graphically ;
- Calculation and interpretation of various basic measures : measure of central tendancy, dispersion, shape and concentration ;
- Analyse and quantify the relationship between two variables and measure the strength and direction of this relationship ;
- Calculating indices and learning about their meaning, usefulness and use;
- Using the most important programs (Excel) to dispaly the data and calculate the most important indicators that were discussed .
-
Students must have developed strong understanding of the basic concepts related to their fields of expertise, namely, mathématics 01 and mathématics 02.
-
the aim of this axis to provide concept and terms specific to statistics
By the end of this axis the student will be able to
- Define statistics and basic statistical terms.
- Explain the meaning and importance of statistics.
- Use statistical concepts to classify data or variables.
- Distinguish between different types of statistical variables and data sources.
- Assess the reliability of various statistical data sources.
- Design a simple plan for collecting and organizing statistical data.
-
By the end of this axix the student will be able to
o Define qualitative variables and types of data displays.
o Explain how qualitative data can be organized and represented.
o Construct frequency tables and simple charts for qualitative data.
o Compare different graphical methods (e.g., bar chart vs. pie chart).
o Evaluate the clarity and accuracy of tabular or graphical presentations.
o Design an effective table or graph to present qualitative data for a real situation.
-
-
By the end of this axis the student will ba able to
o Define the main measures of central tendency (mean, median, mode).:
o Explain the differences between arithmetic, geometric, and harmonic means.
o Calculate various measures of central tendency for given data sets.
o Compare which measure best represents different types of data distributions.
o Assess the appropriateness of a specific measure of central tendency in real-world contexts.
o Design examples or datasets to illustrate how different measures of central tendency behave.
-
By the end of this axix the student will be able to
o Define the main measures of dispersion (range, variance, standard deviation, etc.)
o Explain the concept of variability and its importance in data analysis.
o Compute different measures of dispersion for a given dataset.
o Compare the dispersion of two or more datasets using statistical measures.
o Assess which measure of dispersion is most suitable for specific types of data.
o Design a small dataset and illustrate its variability using appropriate measures.
-
Opened: Sunday, 4 May 2025, 6:00 AMClosed: Sunday, 4 May 2025, 11:59 PM
-
After studying this unit, you will be able to:
-
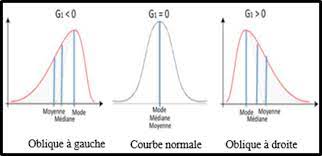
Describe the concepts of skewness.
-
Explain the different measures of skewness.
-
Describe the concepts of kurtosis.
-
Explain the different measures of kurtosis.
-
Explain how skewness and kurtosis describe the shape of a distribution.
-
-
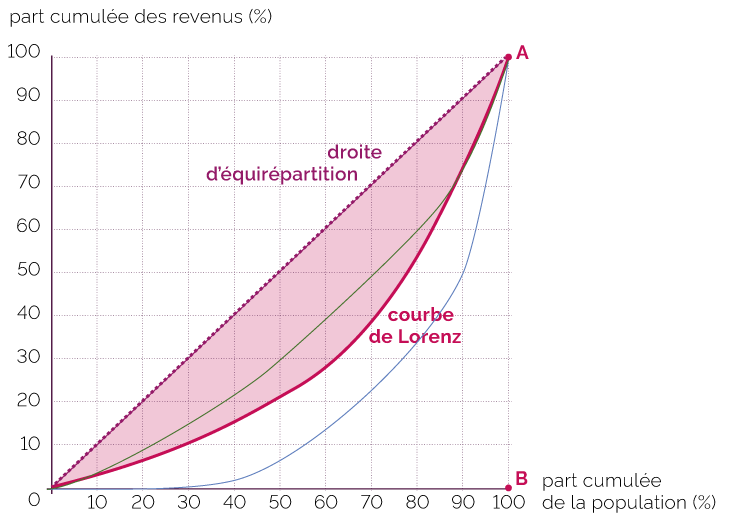
o Define the Lorenz curve and Gini coefficient.
o Explain how the Lorenz curve illustrates income or wealth distribution.
o Plot a Lorenz curve for a given dataset
o Interpret the degree of inequality from a Lorenz curve or Gini coefficient.
o Assess the fairness or inequality in a distribution using the Lorenz curve and Gini coefficient.
o Construct hypothetical income distributions to demonstrate different levels of inequality.
-
By the end of this axis the student will be able to
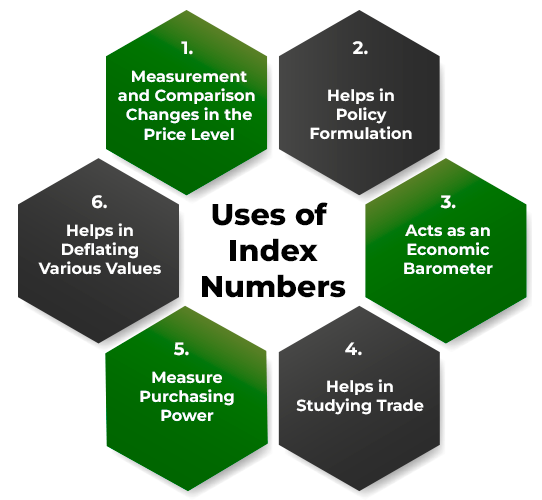
o Define index numbers and their purpose.
o Explain how index numbers track changes over time or across regions.
o Calculate simple and weighted index numbers for given data.
o Compare different types of index numbers and their interpretations.
o Assess the reliability and usefulness of an index number in a real-world context.:
o Construct an index number to illustrate changes in a selected variable or sector.
-

1. Freedman, D., Pisani, R., & Purves, R. (2007). Statistics (4th ed.). W. W. Norton & Company.
2. Moore, D. S., McCabe, G. P., & Craig, B. A. (2021). Introduction to the Practice of Statistics (10th ed.). W. H. Freeman.
3. Triola, M. F. (2024). Elementary Statistics (14th ed.). Pearson.
▪ Bluman, A. G. (2018). Elementary Statistics: A Step by Step Approach (10th ed.). McGraw-Hill Education.4. Samuels, M. L., Witmer, J. A., & Schaffner, A. A. (2016). Statistics for the Life Sciences (5th ed.). Pearson.
5. Larsen, R. J., & Marx, M. L. (2012). An Introduction to Mathematical Statistics and Its Applications (5th ed.). Pearson.
-

This space is for audiovisual communication between the professors and the students
Subject: Reminder: Online Session – Introduction to Statistics01
Dear Students;
I hope this message finds you well!
This is a kind reminder that we will be holding a videoconference on Sunday, April 27th, 2024, at 18:00 p.m. via Jitsi.
In this session, we will be covering Chapter 1 of the "statistics01" course. Your active participation will help you grasp the core concepts and prepare for the chapters to follow.
The session will be conducted by Dr. GHIDA FOUZIA, who will guide the discussion and answer your questions.
We highly encourage you to join us and take advantage of this opportunity to deepen your understanding of the course material.
Looking forward to your participation!
Best regards
