the seventh axis: concentration measurements
Section outline
-
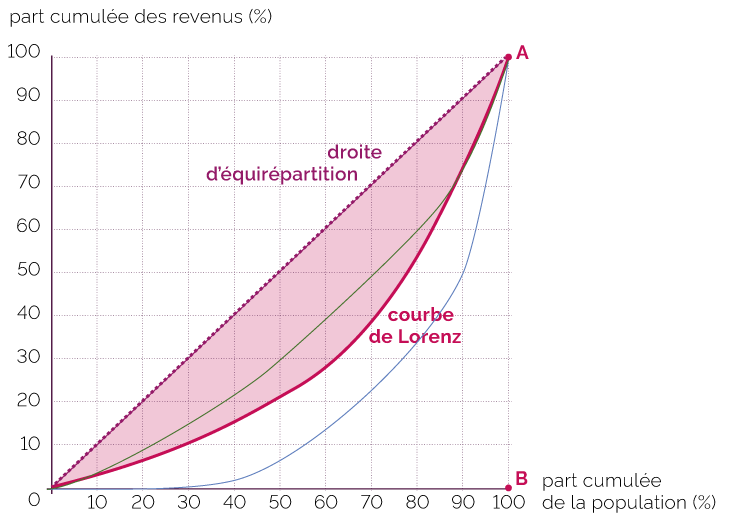
o Define the Lorenz curve and Gini coefficient.
o Explain how the Lorenz curve illustrates income or wealth distribution.
o Plot a Lorenz curve for a given dataset
o Interpret the degree of inequality from a Lorenz curve or Gini coefficient.
o Assess the fairness or inequality in a distribution using the Lorenz curve and Gini coefficient.
o Construct hypothetical income distributions to demonstrate different levels of inequality.